Spatiotemporal domain of neuroscience methods

Summary

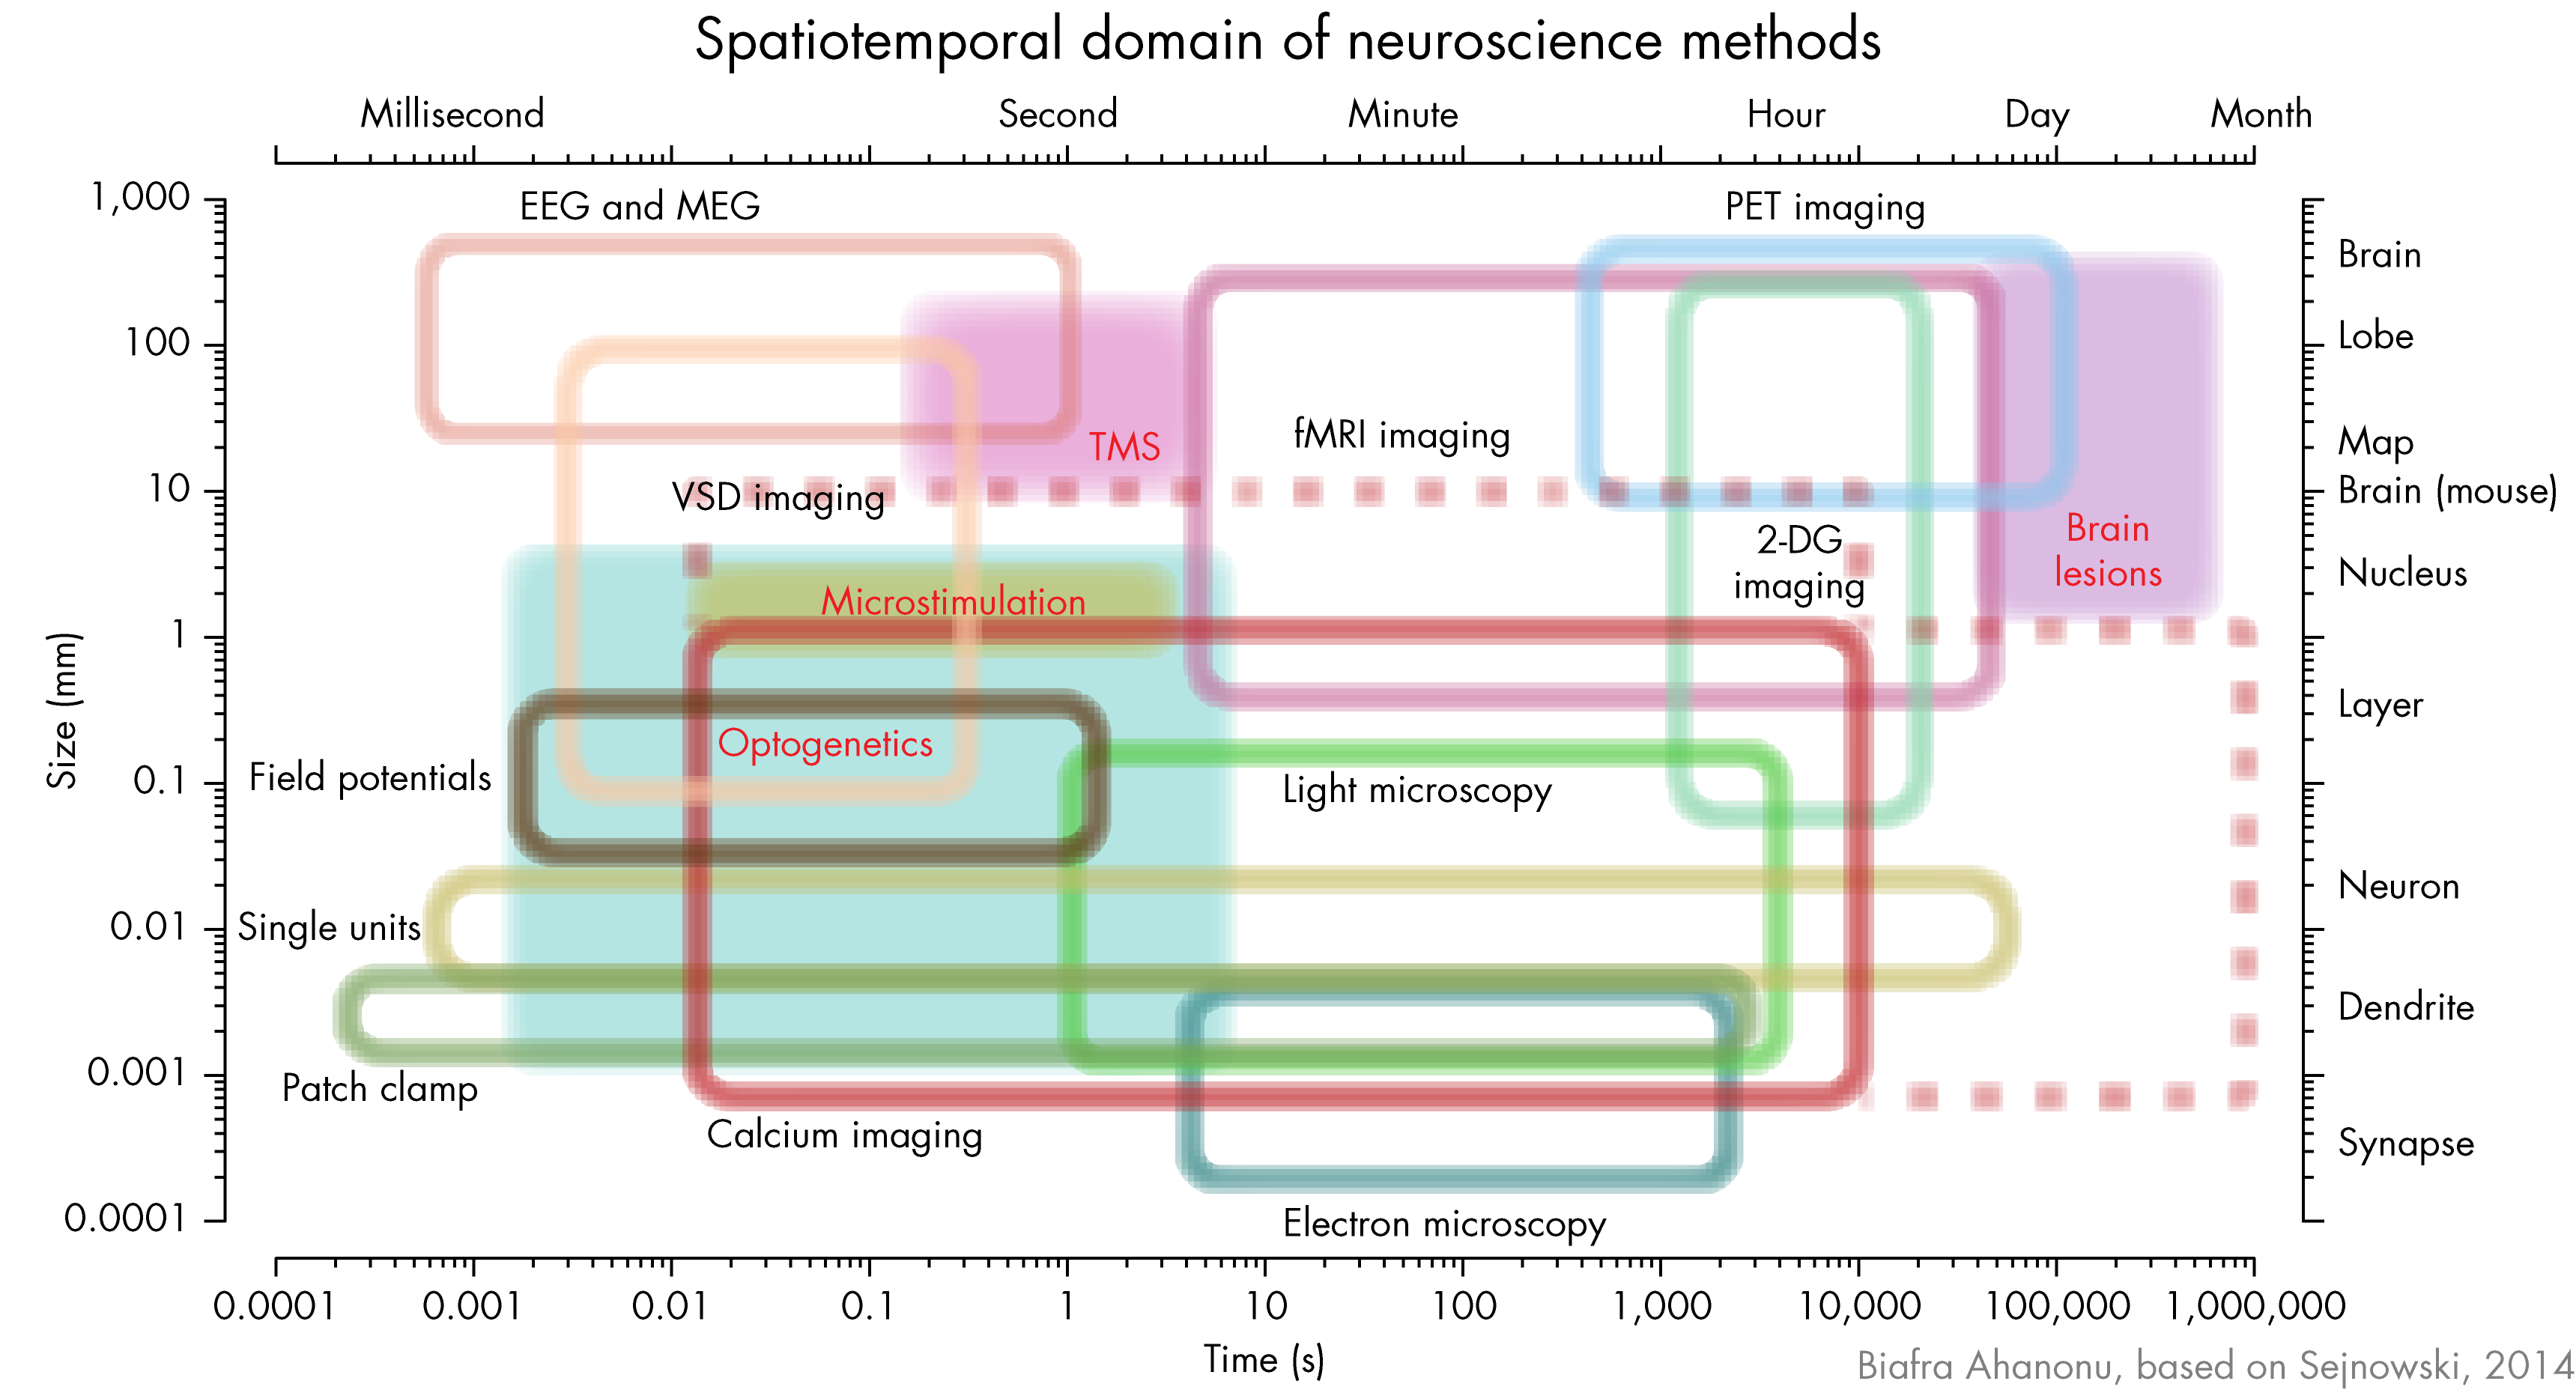
An updated spatiotemporal domain of neuroscience methods graphic, inspired by from Sejnowski, 2014. More changes will be added in time.

One of the goals of the BRAIN Initiative is to expand our ability to record and manipulate cells across a large range of spatiotemporal domains. To give scientists and the public a better sense of this during talks and in general, it would be nice to have clear graphics that layout the major techniques and the scales at which they operate with reference to both precise and layman understandable units. The underlying files used to make these graphics should also be public, to allow others to improve and adapt them.

I converted the spatiotemporal domain of neuroscience methods graphic from Sejnowski, 2014 into a vectorized format that can be used by researchers, journalist, and others. Some slight updates have been made to take into account advances in certain methods (e.g. I'm biased toward calcium imaging 😎). More changes will be added in time.

Below are copies of the Adobe Illustrator vector graphic file and PNG versions of the light and dark themes (at 600 dpi).

Any suggestions on methods to add or updates to the range of any of the methods currently included are welcome.

-biafra
bahanonu [at] alum.mit.edu

other entires to explore:

satellite-based videos: eastern europe during the russia-ukraine conflict
30 november 2022 | satellite

To visualize the nighttime lights of Eastern Europe, with a focus on times before and after the ongoing Russia-Ukraine conflict, I updated [...]my geoSatView R code originally built to view forest fires in the west coast of the United States to use satellite data from VNP46A1 and other datasets collected from the Suomi NPP VIIRS satellite.

I then created higher-quality movies in MATLAB by using the VNP46A2 Black Marble dataset collected by the same satellite, which has reduced cloud and other artifacts due to additional data processing. This allowed me to quantitate a permanent reduction in nighttime lights within Ukraine (in line with my initial hypothesis) and identify a multi-stage reduction of nighttime lights in Kiev's outer neighborhoods/metropolitan area that was greater than that seen in the city core/center. This highlights the utility of public satellite data to quickly test hypotheses and visualize large-scale changes.

I will go over how the Black Marble dataset is collected and processed along with how I created the movies and the advantages/disadvantages of each data source.

Using this platform and codebase, in follow-up posts I will look at 2021 Texas power crisis during the winter storms, vegetation changes in deforested areas or after conservation efforts, and other events.

Tsai Lab
26 December 2011 | designs

Implemented the mock-up during a wait at Logan airport. It is world's better than the current site, both navigationally and on the eyes.[...]>

the origin and evolution of life
01 january 2020 | origin and evolution of life

I am starting a new blog focused on the Origin and Evolution of Life. Here is the first post.[...]
©2006-2024 | Site created & coded by Biafra Ahanonu | Updated 17 April 2024
biafra ahanonu