 stanford
 linkden
 github
 goodreads
 medium
 twitter
One can create art with data, many have proven that with beautiful infographics or dazzling company reports. I thought using R to create an artistic rendering of a normally mundane process would be neat. I developed a graphic based on Cheyne-Stokes respiration using ggplot. Code is included at the end.
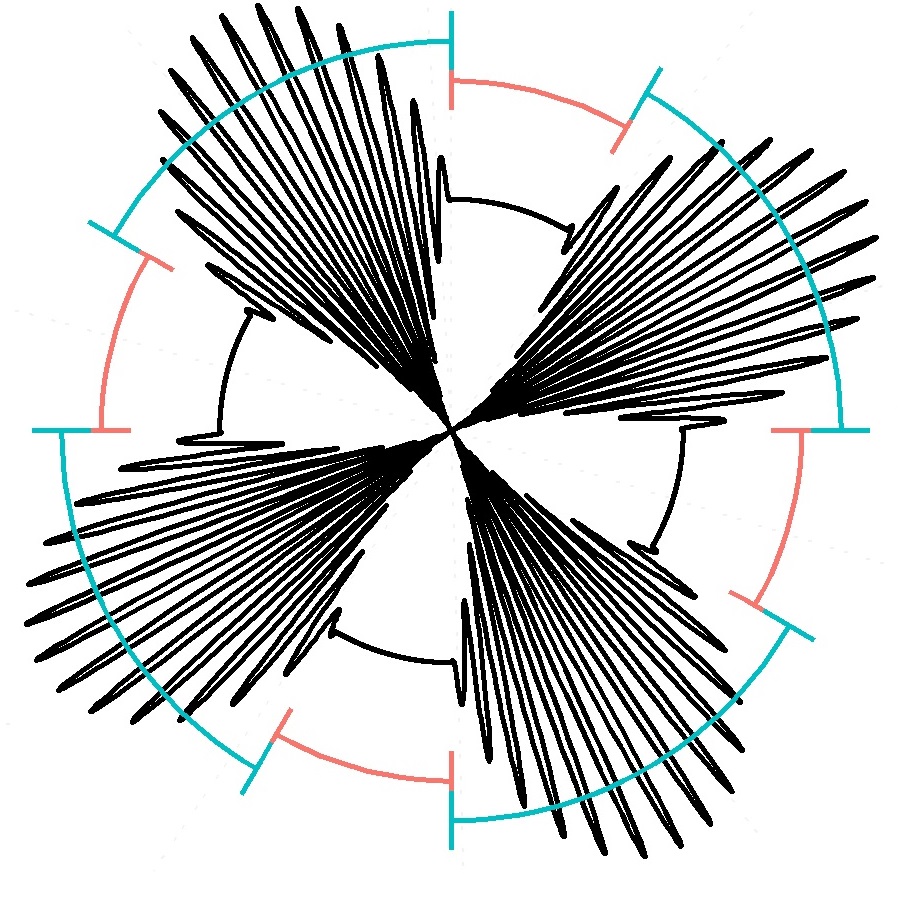
One can create art with data, many have proven that with beautiful infographics or dazzling company reports. I thought using R to create an artistic rendering of a normally mundane process would be neat. I developed a graphic based on Cheyne-Stokes respiration using ggplot.
I think the resulting work (right) has a sci-fi feel to it (think Galactic Empire from Star Wars), almost like it could be a symbol for a corporation should the sinusoidal lobes be made solid. Below I have included the full code needed to replicate the graph, most of it is automatic after specifying a couple of parameters. This was the main advantage of coding the design over manually creating it, I could iterate quickly until I found a look that I agreed with sans wasting a lot of time doing fine adjustments.
I won't go over the code in detail as it is largely self-explanatory (though pardon an inefficient techniques, this was a five minute job completed during a meeting). Basically I use a mirror set of times centered around zero to create a smooth, enveloped sine wave (hyperpnoea) and include bouts of no breathing (aponea). The bars to signify hyperpnoea/aponea are just modified error bars and the entire image is made more salient by shifting the coordinates to polar.
Note: The code isn't fancy (made during a meeting), so pardon the lack of efficiency or beauty at parts. The black line is the breathing rate while the red and blue interlocking lines signify aponea and hyperpnoea, respectively.
- # biafra ahanonu
- # updated: 2013.04.12
- # short script to make an artistic rendering of cheyne-stokes respiration
- #________________________________________________________
- # Load libraries and dependencies
- # For plotting
- # Add time-stamped footnote to graphs
- #________________________________________________________
- # amplitude of breathing, script auto-adjust parameters to this
- breathing.amplitude = 42;
- # set the frequency of the resulting curve
- # make a forward and back hyperpnoea, to make an envelope sinusoid
- # state number of cycles to repeat hyperpnoea and aponea
- cycles = 4;
- # length of hyperpnoea/aponea cycle
- # add noise to the signal of desired
- noise = 0; #runif(length(time),1,breathing.amplitude^2);
- # make a dataframe of the value and times
- # create data.frames containing location of hyperpnoea/aponea lines
- hyperpnoea = data.frame(min=minC+length(aponea.seq),max=maxC+length(hyperpnoea.seq),y=(breathing.amplitude^2)/1.5,x=1,id="hyperpnoea");
- # set bar height
- bH = (breathing.amplitude^2)/4;
- # ggplot of heart respiration
- # I have not included by graphing wrapper function for simplicity'hyperpnoea.seq sake
- geom_line()+
- # add hyperpnoea/aponea bars
- ylab('depth of respiration')+
- xlab('time (hyperpnoea.seq)')+
- ggtitle('Cheyne–Stokes respiration')+
- # theme_set(theme_grey(base_size = 25))+
- theme(axis.text.x = element_text(angle=90,hjust=1,vjust=.5,color="white"),panel.background=element_rect(fill="white",colour="white"))+
- theme(panel.grid = element_line(linetype="2925"))+
- theme(axis.text = element_text(color="white"),axis.ticks = element_line(color="white"))+
- coord_polar()
- # save a copy of the chart to the current directory
- makeFootnote()